- Home
-
Main Instruments





.webp)


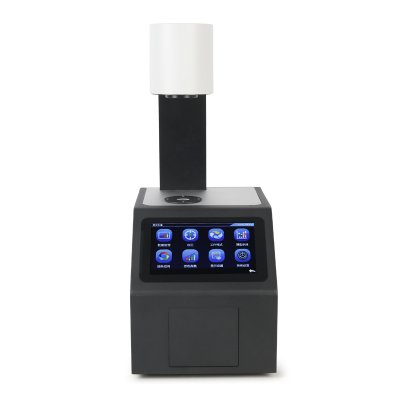
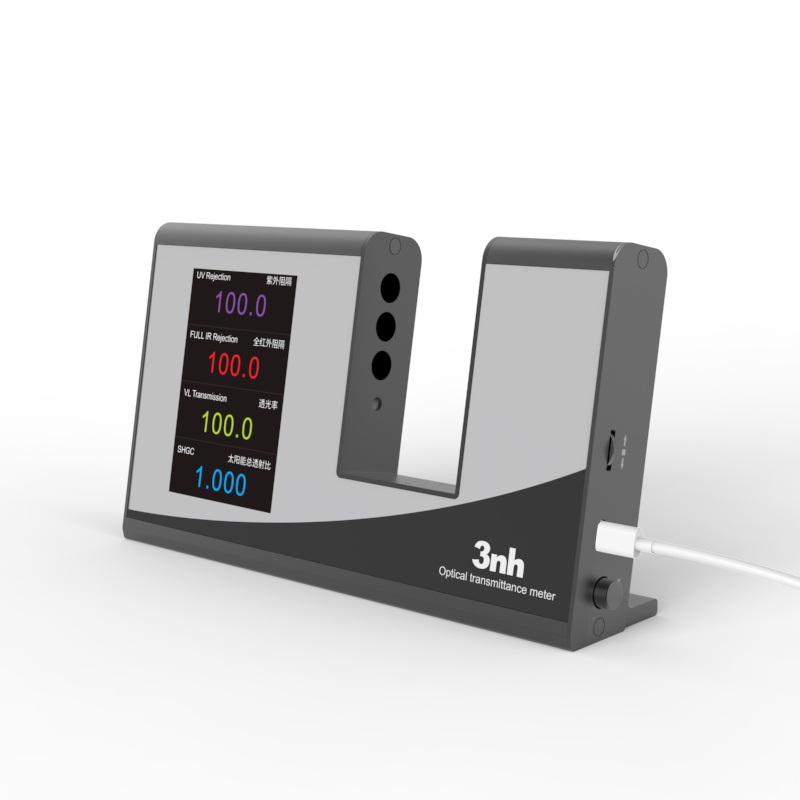
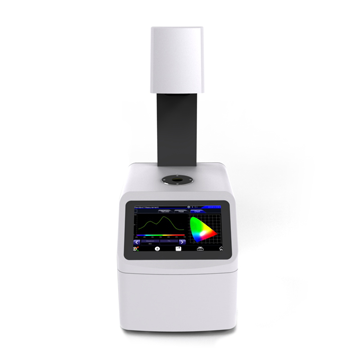
YS6002-M Benchtop Color Haze Meter(Planned Production Halt)


.webp)
.webp)
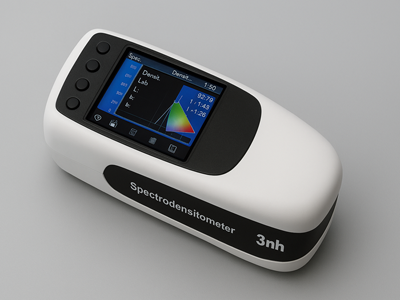
TS1060 Spectrodensitometer (Advanced Edition)
TS1050 Spectrodensitometer (Professional Edition)
TS1010 Spectrodensitometer (Standard Edition)
Spectrodensitometer YD5050 Plus
.webp)
.webp)
.webp)
.webp)
.webp)


MS3012 Multi-angle spectrophotometer
8 Angle Color Spectrophotometer MS3008
MS3006 Multi-angle spectrophotometer
New KS Series Multi-angle Spectrophotometer






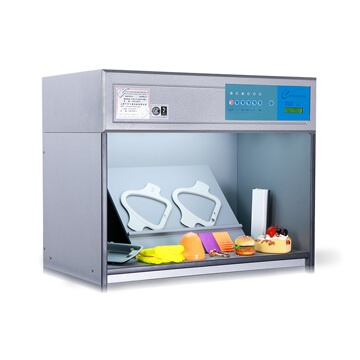
M60 American color light booth
CC120-W Hanging Light Booth Viewer
CC120 Color Viewer Light Table
T60+ Color Light Booth (Updated version)
P120 Oversize Color Light Booth


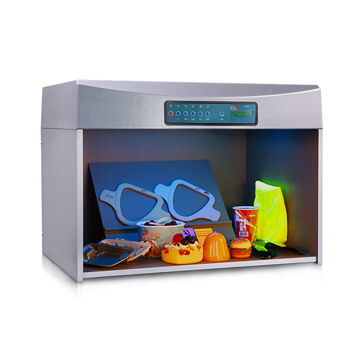


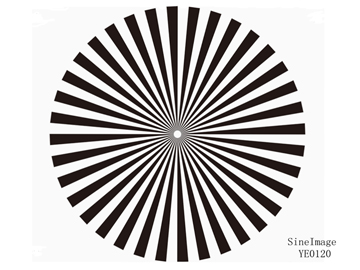
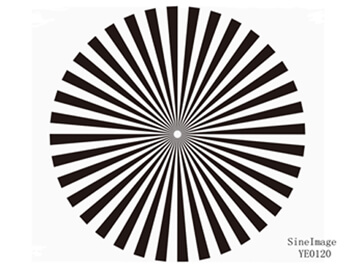
Sector Star Test Chart (36 cycles)
Sector Star Test Chart (72 cycles)
Streaking Measurement Test Chart
Critical Flesh Tones Test Chart
Black & White Spilled Coins (Dead Leaves) Test Chart



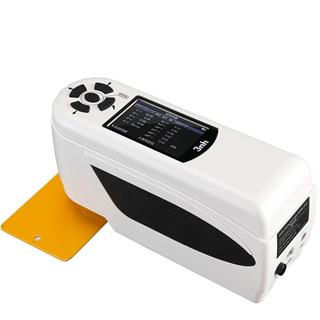
TS7036 Precision Spectrocolorimeter
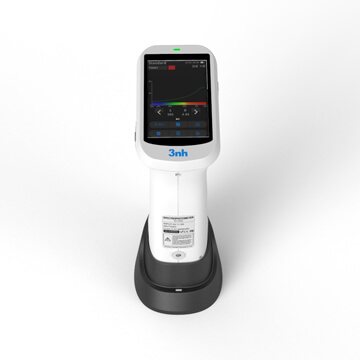
TS7030 Portable Spectrocolorimeter
TS7020 Portable Spectrocolorimeter



.webp)
.webp)
.webp)
-
Innovative Solution
In the textile production process, color consistency is a complex and easily affected by a variety of factors, and color testing and management is the core to ensure product quality and consistency.

In automotive manufacturing and automotive parts manufacturing, color consistency and accuracy is critical because it directly affects the appearance of the vehicle, brand image and customer satisfaction.

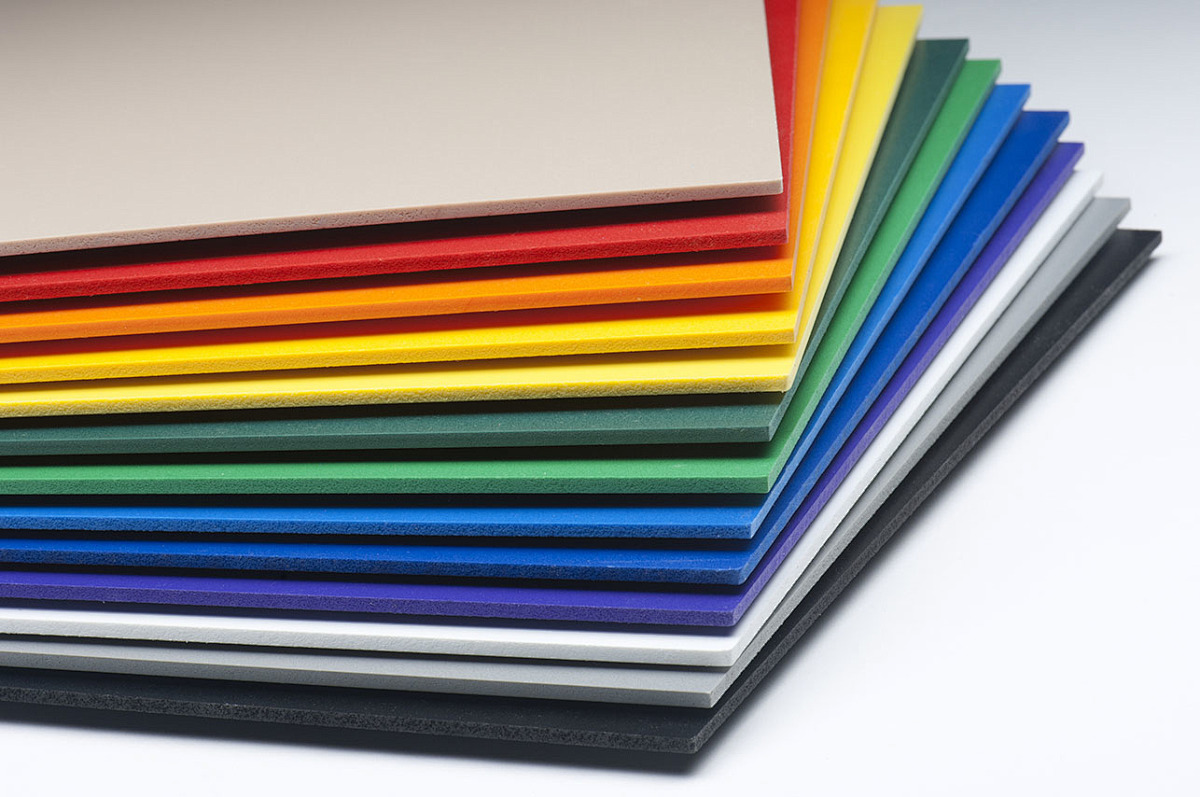
In the plastics industry, color measurement is crucial, mainly in ensuring product consistency, maintaining brand image, strengthening quality control and enhancing customer satisfaction.

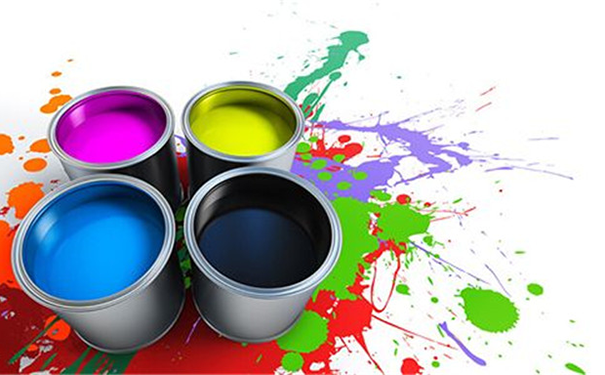
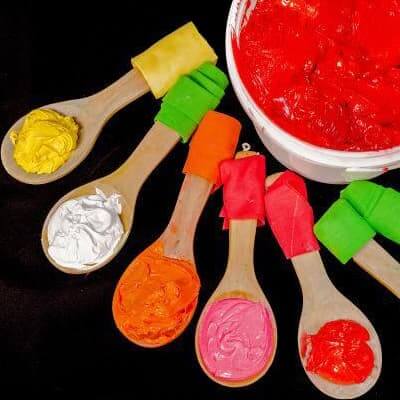
Color management in coatings is key to maintaining product quality and competitiveness in the marketplace.
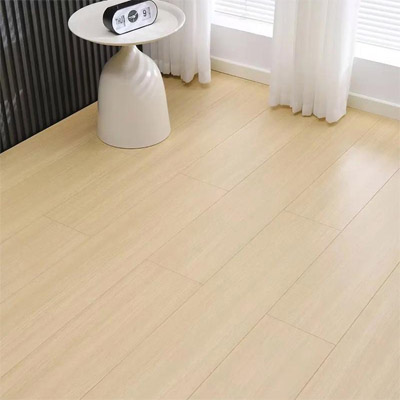
Ensure Accurate Color in Building Materials Solutions; Color management in the building and decorative materials industry is crucial for ensuring the aesthetic appeal, consistency, and market competitiveness of products.
Color management of medical materials is key to ensuring product functionality and safety.
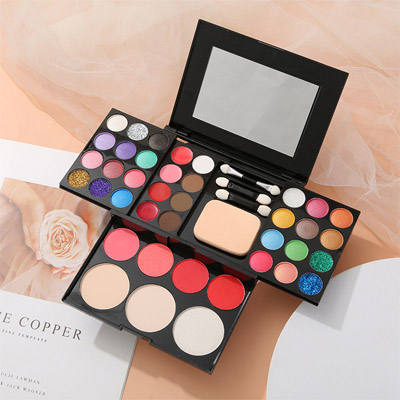
In the cosmetics industry, color testing is key to ensuring product quality and brand image, and is critical to product development and market performance,3nh Provides Services In cosmetic Color Measurement, China leader in color management, measurement, and control, offers cosmetic spectrophotometers, densitometers, colorimeters, and color measurement software.
Color testing plays a key role in the produce and food industry because color not only affects the appearance and attractiveness of a product, but also reflects its quality and freshness.
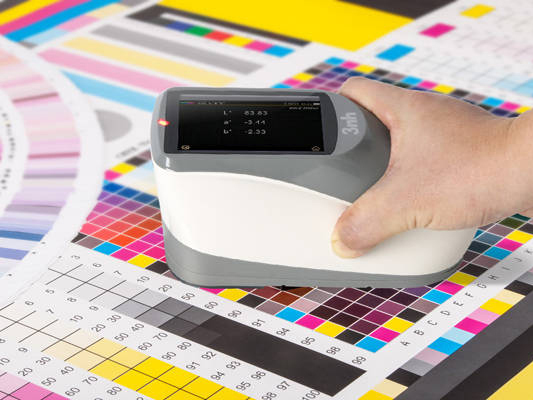
The importance of management in the packaging, printing and paper products industry is reflected in several key areas. 3nh Provides Services In Printing Color Measurement, 3nh is the China leader in color management, measurement, and control, offers printing spectrophotometers, densitometers, colorimeters, and color measurement software.
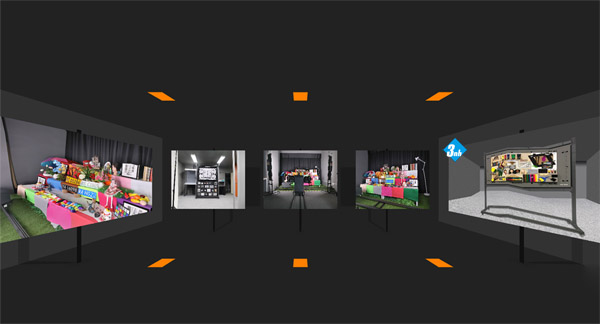
Imaging Test Laboratory Solutions, Sine Image’s customized imaging test laboratory is equipped with wide-angle test light boxes, 7 sets of fixed color temperature test light boxes, various test charts (such as skin tone test charts, resolution test charts, distortion test charts, real-scene subjective test charts, etc.), chart holders, fill lights, and other equipment. Its testing solutions and products are widely used in industries such as security monitoring, automotive imaging, photography, medical imaging, televisions and computers, mobile phones, and drones for image quality inspection.
-
Service&Support
Frequently Asked Question about Appearance&Color Measuring Instruments, On this page you will find a few frequently asked questions and tips that are relevant for the vast majority of our Measurement Instruments equipment. Do you have a question about products from Threenh?

Catalogues, Brochures, Flyers, Certificates, Technical information and more; Any document requirement please download here to achieve well understanding for colorimeters, Color Spectrophotometer, Gloss Meter, Color assessment cabinet products, Threenh Technology is a precision instrument company dedicated to research and development, production, sales, and technical services.
IQstest is an image testing software developedby 3nh‘s SINE IMAGE company, Have many yearsof experience in image inspection, supporting Resolution Charts、ComprehensiveCharts、Dynamic Range Charts、Gray Step Charts、Distortion Charts、ColorChecker、White、Balance Charts、Fov Charts、Custom Charts.
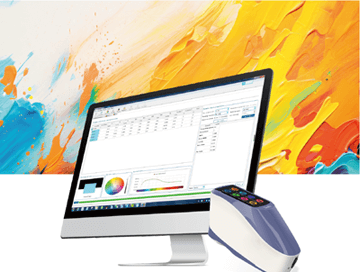
PeColor Color matching software, Focusing on the overall color solution, A spectrophotometer +PeColor, Make color matching so easy!
Threenh offers you quality after-sales service . Need troubleshooting, repairs, or a maintenance contract? Contact our teams! 3NH Warranty Terms; Guangdong Threenh Technology Co., Ltd. (hereinafter referred to as “3NH”) provides a limited period of warranty service to clients (hereinafter referred to as “client”) who have purchased products manufactured by 3NH (hereinafter referred to as “Product”) in accordance with the terms of this Warranty Policy (hereinafter referred to as “3NH”).

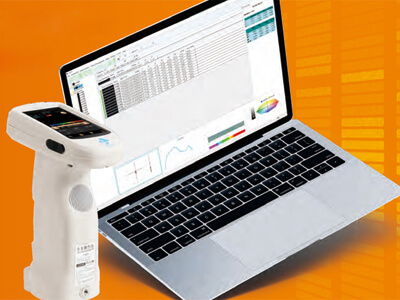
3nh offers a variety of color quality control software solutions. Below are some common software programs and their relevant information: Here is the introduction to 3nh‘s quality control software
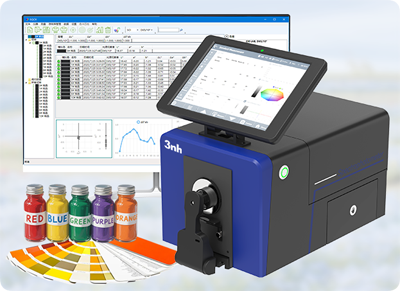
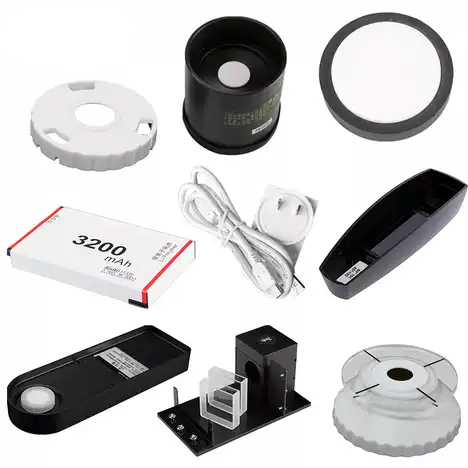
Equip your team with affordable high-performance corlorimeter and spectrophotometer devices customized to your unique business. According to client’s demand to provide personalized ODM design & services, helping clients to enhance their brand’s competion advantage. Freely customize your instrument now!
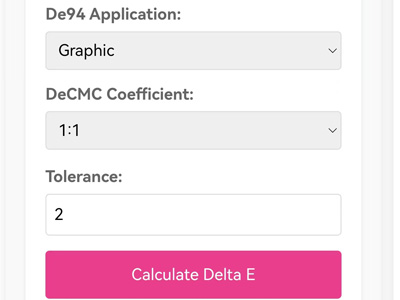
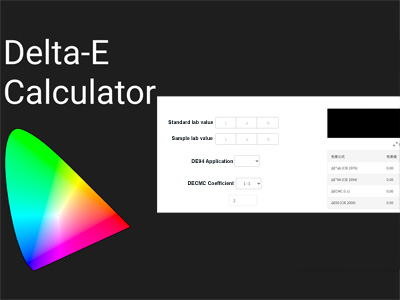
It includes converting the CIE Lab values of the standard color and the sample color. This tool allows you to find the right color difference by adding numbers into the CIEDE2000 formula (CIE 2000) after entering these values.
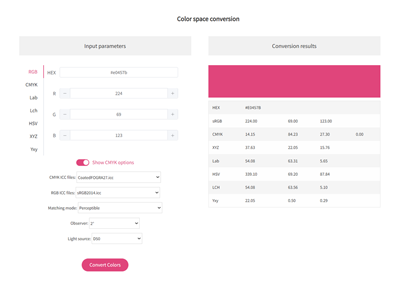
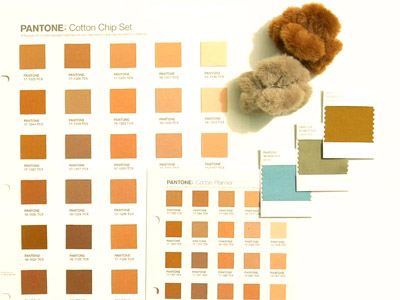
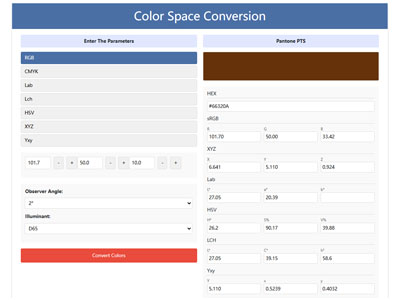
Free Color Converter: One-Click Color Transformation, RGB CMYK HEX Lab Lch HSV XYZ One Click Conversion, Professional Color Space Tools, Easily Convert RGB CMYK HEX Lab Lch HSV XYZ to Pantone (PMS) – Try Our Tool, Simple Accurate Conversion color Space with Our Converter
-
Resources
3NH Company News Center, News and Events, Exciting Developments,our news center serves as a dynamic hub of the latest happenings and developments within the company and the industry we thrive in. Here, you will gain exclusive insights into our continuous pursuit of innovation and excellence. Color Management Leader 3NH The Latest News
The Latest Product News from the Leaders in Color Management, Stay up-to-date with all the latest news from Threenh ! Discover our latest innovations, recruitment announcements, new products, press releases, and more.
Discover the latest tech news and measurement products from threenh technology. Shop innovative tech solutions or measurement instruments for your business now! No matter what you want to measure, we have done the groundwork to help you find the right color measurement tool.
Get essential Basic color Knowledge with threenh Technolgy. Explore smart solutions for your business needs. Contact us today! Here is where you will find upcoming color tech and startup events around the world.
what is transmittance
What does color fastness
What is Metamerism?
Gardner color
What is Delta E?
3 Primary Colors3NH Industry News Center, News and Events, Exciting Developments,our News Center serves as a dynamic hub of the latest happenings and developments within the industry we thrive in. Here, you will gain exclusive insights into our continuous pursuit of innovation and excellence. Enhance your understanding of color testing and precise quality control indistinct applications
-
About Threenh
Embark on a virtual journey through our state-of-the-art manufacturing facility. Witness the precision and efficiency of our production lines as they bring to life our high-quality instrumentations and other advanced products.
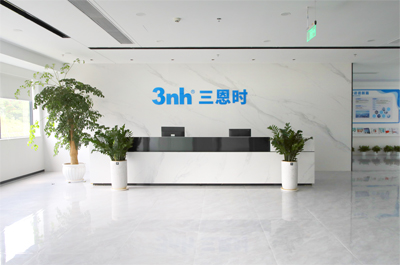
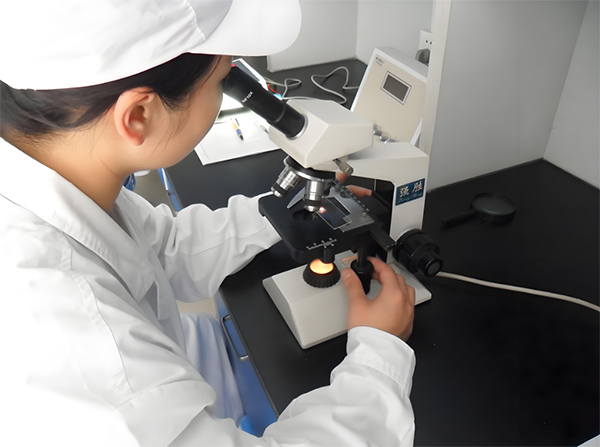
Provide solutions to different markets by delivering a complete range of measurement instrument Products and ODM Services to our customers. From meticulous material sourcing to precise assembly and strict quality inspections, every step is carefully orchestrated to ensure efficiency, consistency, and compliance with international standards.
Account Name: Guangdong ThreeNH Technology Co., Ltd. Account NO: 6652 7828 9156 Bank Name: BANK OF CHINA LIMITED GUANGZHOU ZENGCHENG SHITAN SUB-BRANCH

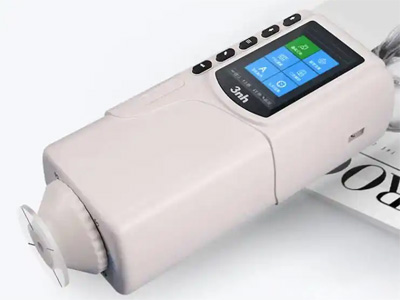
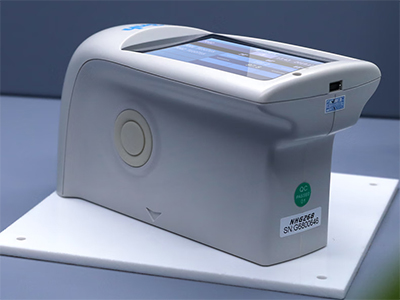
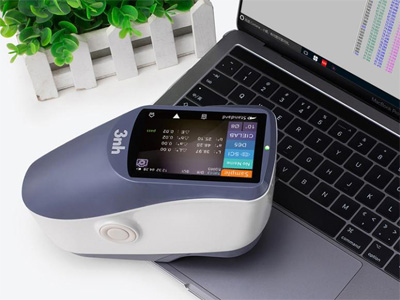
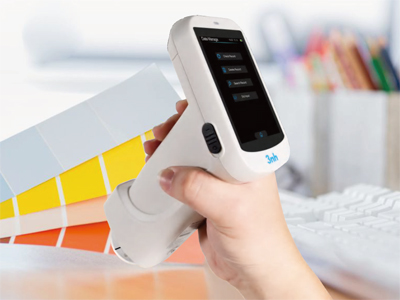
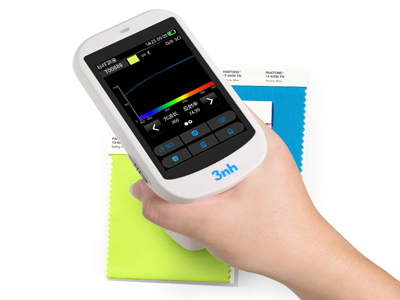
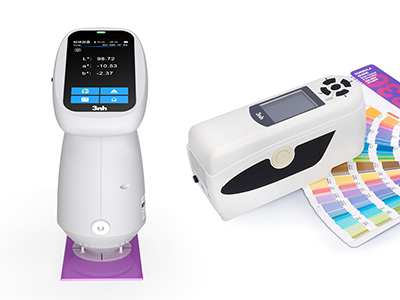
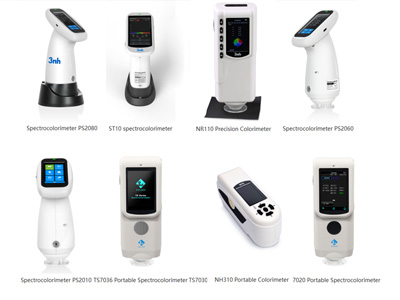
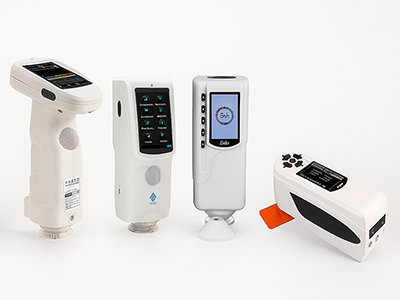
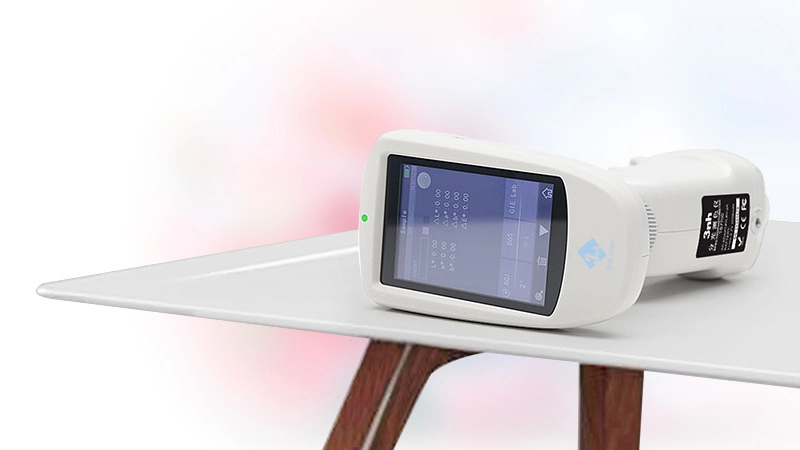
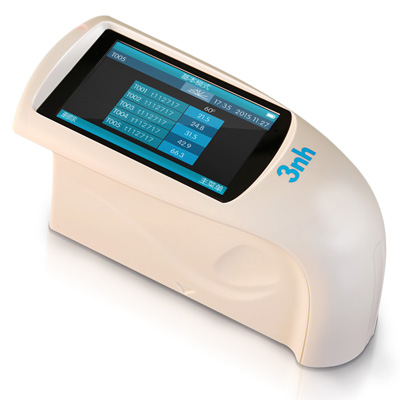
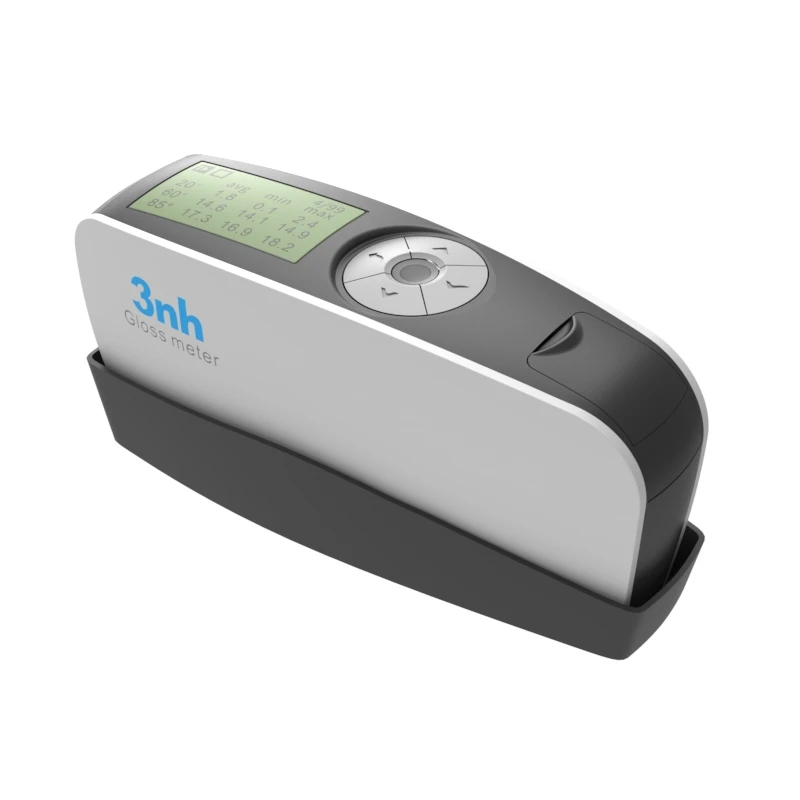
Color Measurement Devices Products List, wide range of color meters, 3NH Color Measurement Devices are a series of high-performance tools designed for precise color detection, analysis, and quality control across industries. Equipped with advanced optical sensors and intelligent data processing technology
-
Contact
3NH is actively expanding its international distributor network across the Automotives, Textiles and Apparel, Printing& Paper, Plastics, Painting and Coating, Building Materials, Chemical&Pharmaceuticals, Cosmetics, Food and Agricultural industries. We are looking for technically capable, committed, and growth-oriented partners who want to build long-term success together.






.webp)
.webp)
.webp)